Saturday, 27 April 2013

22-26 April, Bonus week for me

On 22nd April 2013:
EUR/JPY pair opened its trading day with a gap upwards after the weekend. Price usually fills up the gap. As price was moving upwards, price needed to fill the gap with a retracement during it's upward move. Price was near in the making a double top. I entered short.
EUR/JPY h4 chart
I grabbed 56 pips when I exited as price was near the closing price of last week. Price is likely to move down further but I don't wish to keep it open further as price will commence it's upward trend after the retracement. Trade against trend is always risky. I just wanted to trade the gap. I have another trade open at XAUUSD. It has 200 pips gain with >100 pips profit locked in by trailing stop. My weekly target easily filled on the first day of the week. So rest of the week will be bonus for me. Thus, no risky trade for rest of the week.

Update: I exited with 257 pips gain.

25th April 2013:
I'm watching AUDCAD now. In the larger time frame, this pair is in uptrend. In daily chart it's in uptrend as I mentioned earlier. But see the last retracement from the upward thrust.
First, it formed a double top. Second the retracement is more than 100% of the main thrust. So I switched towards lower time frame to find out a changing trend. In h4 time frame the price is in down trend and already has 4 swing completed.
Now price has some confluence here... a diagonal TL, dynamic resistance, a horizontal support/resistance line. So I zoomed to h1 time frame.
Price is range bound here. I'm planning to go for short with the breakout of this range. If price breaks out upward then this set up will be cancelled.

After going back in the history, I've found that price was at this level way back in 1997. Price went as high as 1.1090 where price is now at 1.0555. This means a possible end of larger time frame trend.

Let's see whether I can get my entry this week or end of trend set up.

26th April 2013 at 12:40 am: I failed to monitor it. It broke out below with a breakout-pullback-continuation pattern. Missed >20 pips in this trade according to the movement till now.

Breakout from the a range gave >70 pips till now. I waited for it but missed it due to failure to watch it at the right time.

I'm now looking to go for longer time frame trade. USDJPY pair in weekly chart. This pair is now visiting a previous supply area. So an opportunity for short here.
I entered a short with s/l above the area and t/p above the lower demand area. In the daily chart, price is forming a double top. Here is the daily chart-
It's an uptrend. So short entry is not ideal. But I took this trade to see whether supply-demand only can make good trade irrespective of trend. I know, real supply-demand area identification is the prior requisite here. I'm learning here. Thus, don't take my trade data as signal.
>100 pips gain till now and the trade is still open. Let's see what happens next week. I'll keep it open until it hits either the sl or tp.

Happy trading!


Monday, 22 April 2013

My plan for the next week-22-26 April 2013

I was busy with my patients. That's why I just wrote down the pairs of interest so that I can come to write about them later.

Now, GBP/NZD pair in D1 time frame, clearly in down trend and price is retracing back to dynamic resistance area. Diagonal trend line and recent couple of resistance level were around the same place. Price at the moment in ranging in lower tf-h4. I'm waiting for a breakout downwards.

If price breaks out above then I'll cancel this set up and this trend is going to end here.

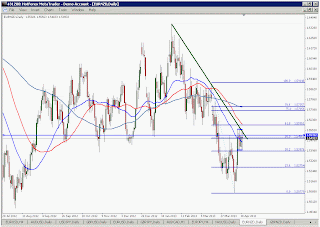
EUR/NZD pair also have similar picture:

Price is in a good downward movement. The retracement from downward move is now around 50-61.8% fib level.

As GBP/NZD, EUR/NZD is ranging now. So waiting for a breakout.

EUR/USD pair is in bear channel on monthly chart. So i'm bearish in it in for a long term trade.

Figure: EUR/USD Mn

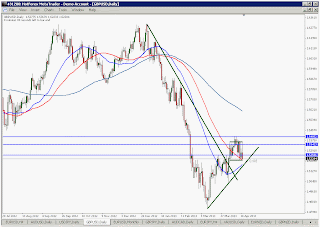
In GBP/USD- we're now in dynamic reistance area with a diagonal trend line in place. Price is also ranging now. And retracement trend line also formed. I'll go short with the break down of both of them.

Figure: GBP/USD D1
In GBP/JPY and USD/JPY pairs, price is in upward rally. I'm watching them.... I'll try to enter with the retracement to the dynamic support area.

======================================
GBP/NZD, EUR/NZD--Sell
GBP/USD, EUR/USD--Sell
GBP/JPY, USD/JPY-waiting for buy

details coming soon

Saturday, 20 April 2013

JPY pulled back from retracement

Recently I've taken a course on forex trading. This is one type of price action trading. So far, not bad. Last week I've traded JPY pairs as I had special attention on all of them.

To tell the truth, most of the time I was on study. Very little time to monitor price charts. So I'm going to tell about the two trades I had this week. My weekly target is at least 100 pips.

First, EUR/JPY pair. This pair is in uptrend. But now this was retracing and was moving sideways. I was watching it and waiting to see whether it is continuing it's main trend or breaking it. Yesterday when I was checking the pair, I found that it produced a triangle which is a form of consolidation.
At the base of that triangle, there was a nice pinbar which was good long entry signal. I missed it as I was studying at that time. Whatever, now price as to break out at any direction. But I'm expecting a breakout upwards.

I got my entry point at H1 time frame when price retrace afer breakout of the upper TL of the triangle. Grabbed more than 70 pips here. After price moving nearly about 90 pips, price again started to move sideways confinding itself in a range. I'm again expecting an upward breakout.
Almost similar price action in GBP/JPY pairs. I shouldn't take trade in related pairs same time as these add risks. But I took the trade as I'm now learning trading by price action. GBP/JPY pair was producing an ascending triangle. So naturally an upward breakout was expected.
Trade entered from 5m chart. I took the trade after the breakout, then pull back and lastly confirmation by the continuation of the prevailing trend. My S/L was below the upper T/L of the triangle. T/P was at 1:2 risk: reward ratio. I got it quickly. Price again came back to the upper horizontal T/L of the triangle and bounced back. Let's now see where it goes next week.

Sunday, 14 April 2013

JPY pairs are reversing or what?

Last week was relatively better for me. EUR/JPY pair gave me about 250 pips. From AUD/CAD pair, I grabbed 37 more pips. Both the trade were long entry. But after giving me good amount of pips, price started to retrace at the last couple of days of last week.

AUD/CAD pair formed a double top at 1.0708 and started to move towards the dynamic support area and the diagonal trend line. I expect price to pull back again. So I'm going to monitor this pair next week because price expected to move beyond the above mentioned level when price broke out from the flag formation in its up trend.

I'm going to keeping my eyes on the following currency pairs. AUD/USD, AUD/CAD, EUR/JPY, EUR/USD, GBP/USD & NZD/USD. I'll tell something more about my plan tomorrow. All the pairs will be monitored in H4 TF.

JPY pairs  will be on my top watch list as the pairs started to fall all at once on the last day of the week. Will it fall until close the gaps or again start to rise up weakening the jpy? Let's see.

Thursday, 11 April 2013

AUDUSD moving nicely up now

AUD/USD pair was on my monitoring list. Employment data caused sharp drop of AUD/USD this morning only to trigger my buy signal for AUD/USD pair. 3 hours after releasing of unemployment and employment data for AUD, on 1 hour chart price came to the dynamic support area which was the 38.2% fib are of the latest low to high. Diagonal trend line also met the same area. Thus a nice confluence was there.
As price crossed the recent resistance & support line, I entered long at 1.05218 with 25 pips s/l. 3 hours after entering long I exited my 50% position at 34 pips. Rest of the position is at B/E.

Sam, in his article often used to tell that news event doesn't interrupt technical analysis. It just augment the speed of price movement. Sometimes may be opposite direction of a trend but ultimately it follows the trend. I started to see this.

AUD/USD pair is now has 60 pips unrealized gain. I have another open trade at AUD/CAD. Price is now forming double top. I'm now at B/E there with 50% of my initial position. Now I'll watching this pair as my target of T/P is way beyond this developing double top. I might get out of this trade as price is making this double top at a level which was last visited in February 2012. I'll get into the trade again after clearing this level.

Risky EURUSD pair

EUR/USD is a highly traded pair. But this is now one of the risky pair. It's move is becoming more and more messy. I was watching the EURUSD pair. Now it's on bullish move as evidenced by the moving averages.
Price is now developing a bear channel and price is now right at the area between 30 & 50 SMA. Which is my dynamic area of support/resistance. Here it's acting as a dynamic support. Above there is an important level 1.3100. If price can clear this level by breaking out from the bear channel then there is 1.3250 is on the way.

Though this pair is bullish on H1 chart but it's bearish on monthly chart.
This pair is also bearish on weekly chart. According to many analyst, the fate of this pair is bearish in the long run. But even then I wish to trade long for short term if it clears the above mentioned level. Because there is a confluence of dynamic area, diagonal trend line, horizontal trend line and presence of a price action where price is consolidating in a bear channel as mentioned above. So with the break up of the channel from the area between moving average and after clearance of important levels, I'll go long. Let's see what happens.

Wednesday, 10 April 2013

Buy signal in USDJPY pair

Sorry for more than a week long absence. This is mainly due to some modification in my trading and blogging schedule. For now I should just concentrate on trading.

Today I was watching some pairs. I have two long positions open in EUR/JPY, AUD/CAD pairs. Both of them are in profits now. EUR/JPY has more than >200 pips in profit. AUD/CAD has >70 pips profit. After closing partially both of them are in trailing stop loss set up.

Now the trade I would like to talk about which I took an hour back. I'm now following course material I purchased and going through the process last week. Here 30 & 50 SMA is acting as dynamic support/resistance.

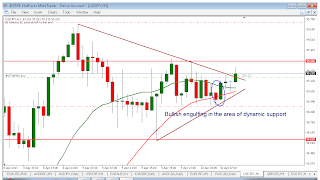
USD/JPY pair was bullish since recent JPY weakening condition. I was watching h1 tf. Price in its upward move, pulled back into the dynamic resistance where they were producing a bullish engulfing price pattern.
Bullish engulfing
I was planning on entry at the close of the candle. But I was little late. After entry price started to move up on the third candle after my entry. I closed 50% of my position at 23 pips and shifted my s/l to B/E.
A quick update of my EUR/JPY pair- it's now >300 pips gain. I'm going to move my S/L further up. It's nice to gain consistently.

Now coming to my plan. I'm reading and watching few courses on price action. So while studying and demo trading, writing blog post becomes to some extent problematic. So I'm going to post about my results of various trade on Saturday and another post about my plan for the next week on Sunday. I think I'll be able to follow this schedule.

Happy pipping!!

Friday, 5 April 2013

New schedule

From now on I'll post on weekends. Details coming soon.

Monday, 1 April 2013

Trading with MAs

Today got 40 + 22 + 17 + 7 = 86

Popular Posts

HotForex Bonus