EURCAD in daily time frame. It's in a clear uptrend since February 2017 by creating higher highs and lower lows.
GMMA shows that shorter time frame bands are condensing where the higher time frame bands are directing upwards and all in order well separated which means a strong trend is prevailing. If price can break out the level 1.5204, I'm interested in going long.
EURUSD in daily time frame. This pair has entered its prevailing uptrend in January 2017.
GMMA is showing that the shorter TF MA bands are condensing which means a probable trading opportunity is on the way.
Price is still creating bear candle. So no sign of restarting the uptrend this week till now. Patience is all that we need now.
EURAUD in the daily time frame. This pair is in an uptrend since February 2017.
Now guppy multiple moving averages are showing that the shorter TF MA bands are condensing and the last candle is now green at the time of writing this article.
If this candle closes with a bullish sentiment or at least an indecision candle then this could be the first sign of probable price reversal. 1.5195 level will be the breakout level when I'm interested in going long for this pair.
EURGBP in the hourly time frame. I was following it for probably a short trade. But since it's election time, it suddenly reversed back for more than 180 pips invalidating this trade set up.
If we can dig into this pair more by going to a higher time frame we'll find some interesting things.
Guppy Moving Averages showing a long trade setup that already broke the level that triggered a long entry. But the price is at a strong resistance where it's now on the way of creating a triple top.
Let's see whether it can break the level or not. If we zoom out the chart we'll see that price is ranging since October 2016.
This is more clear in the weekly timeframe. Now price is at the upper border of the range. So it can break out the level to go up and break the range or it can bounce back from the level to resume the range period for some time more.
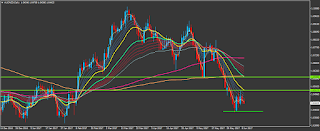
AUDNZD in the daily time frame. Price is in a downtrend since March 2017 by creating lower lows and lower highs.
It showed a small correction before resuming a downward move, 23% fib level to be perfect.
Price is in a downtrend in the weekly time frame and consolidating in the form of a triangle since March 2015. Price is on the lower arm of the triangle. So it's likely that price might bounce back from the level. So going short for longer term might be little risky but there is an opportunity for shorter term trade.
In the weekly time frame price is still below the 200 MA which supports its bearish sentiment.
GBPUSD in the daily time frame. Considering the election, GBP pairs were the risk pairs.
This pair is in a downtrend since November 2015 where it is well below the level of 200 periods MA in the weekly time frame.
So though the guppy moving averages showed probable long trade, weekly time frame didn't support it. And look the setup is being violated by sharp move downwards.
CADJPY in the daily time frame. Price is in a downtrend since December 2016. Now it's consolidating and waiting for a breakout in any direction.
Now there is a probable short entry as lower time frame MA bands are condensing below the higher periods MAs. Price is also below 200 periods MA.
GOLD in the daily time frame. Price is in an uptrend and has created a double top. Now let's see if there is any reversal or continuation of the trend.
There is a support at around 1260-1265. If price bounces back from this level, I'm interested in going long. But if it can break the level successfully, I'm interested in going short with a target at around 1215-1220.


No comments:
Post a Comment