 AUDUSD in the daily time frame. Price is now uptrend and it really crossed above the 200 MA on the 21st December 2017.
So now it's time for buy opportunity only. But Price is in an uptrend since April 2016 in the longer timeframe.
After the last upward swing, the price is in retracement and it's bouncing back from 38.2% fib level.
Price is now forming a piercing line pattern. If this candle can cross above the 20 MA today then it will be a buy signal and I'm going to enter into this trade right away.
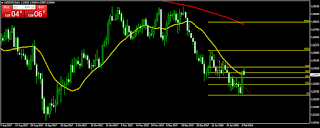
USDCAD in the daily timeframe. Here the price crossed below 200 MA on the 12th June 2017.
Price again retraced back towards 200 MA but didn't cross above rather bounced back down on the 20th December 2017. Price is in a downtrend since April 2016 in the longer timeframe.
Now price is creating lower low and lower high. At this moment price went back above the 20 MA during its retracement. In this process, the price is creating dark cloud cover pattern price action. If it completes the pattern, I'll go for short here. Let's see what happens.
USDJPY in the daily timeframe. Price crossed below the 200 MA on the 10th January 2018. Price is here also creating lower highs and lower lows.
Price is bouncing back from 20 MA after retracing back to the MA. Price is also creating a dark cloud cover pattern price action. Price has almost completed the pattern, but I'll have to wait till the candle closes. So with the completion of the pattern, I would like to enter into this trade.
Negative points: Price is in sideways move in the longer timeframe.
NZDJPY in the daily timeframe. Price crossed above the 200 MA line 20th December 2017. While crossing above the 200 MA line, price broke the earlier downtrend.
After crossing the 200 MA, it retraced back to 200 MA and bounced back. Now it is becoming clearer that price is failing to create new higher high and higher low. But still, I'm going to follow this pair as long as it's above the 200 MA.


No comments:
Post a Comment