Friday, 30 December 2011

Working with Fibonacci Retracement tool

Welcome back after holiday!

I was reading about Fibonacci Retracement tool today. Like when to use it, how to use it etc. So here I picked to learn more about it--

Currency pair: AUD/CHF
Time frame: 1h
Chart created at: 8:20 p.m (GMT +6)

This tool works with trending market. That is, a volatile environment is ideal for this. Here you'll first need to find a swing high and swing low. if you're able to identify then you're ready to draw the Fibonacci Retracement level on the chart.

Now, idea is.... you're going to retracement point within a trend..... that is, in a trend, sometimes price holds a level for some time and goes the opposite direction before reversing/retracing the original trend in place. Now if we get the retracement levels, we can enter the trend. As most of the traders follow this tool, this is self full-filling.

To draw the levels in chart, just pick the tool, in an uptrend put your mouse to previous swing low, click and hold mouse pointer, drag it to the swing high. There you are... software will automatically paint the levels.


Swing high was at:0.95320 on 27th December 2011 at 7.00 p.m
Retracement levels are 0.94734 (23.6%), 0.94295 (38.2%), 0.93957 (50%), 0.93635 (61.8%)
Swing low was at: 0.92623 on 19th December 2011 at 7.00 a.m

Now wait for the price to bounce back.....

Actually these levels work as either support or resistance level according to the direction of market movement. Wait to see what happen next.

Look, price retraced back just hitting the level at 0.94734 (23.6%).... It went all the way through to above previous swing high level....If I could have enter at that level, I would have gained more that 80 pips..

Now, I don't know whether I've used it properly..... I've done it following a tutorial.... whatever, it worked here somehow... If anybody has any suggestion, please come forward....

It'll help my newbie readers to learn and it'll help me as well. I was not within reach of internet... for this I couldn't enter into the trade, otherwise it could have been a live experience of gaining pips with the help of fibonacci tool.


Like every other tools, it's not always give accurate result. So have a nice profitable prediction, some additional tools are needed. For now, I don't have any idea about which tool might be good for Fibonacci Retracement tool. I'll post here as soon as I get an idea....

Saturday, 24 December 2011

Trading with support and resistance

More than months back when I started to read about forex trading, I came to know about the support and resistance level in the chart. At that time I thought that, how can I know, which is support level and which one is resistance. I started to think that, I will need a guide always to point out those levels for me. With the thought in mind, I just started to ignore finding these levels.

Later I started demo trading 1 and 1/2 months back. Very recently while I was demo trading and trying to find out the chart patterns, suddenly I've found that, I started to see those horizontal support and resistance levels. So see the levels in my eyes--
See the top line is acting as a resistance level where the upward price movement bounces off. The middle line was acting as a support line where suddenly price broke down and the support line became resistance line and bottom line became the support line.....


This is what I understood. Now, please comment, whether I'm right or not...

Money management & Psychological management

As a newbie, when I read various tutorial, one thing comes regularly and repeatedly. That is, money management. Without proper money management plan, no one can be a successful forex trader. It's true. Initially when I tried to place order without any planning, I've earned few trade, one very big but lost so many small trade which ultimately took me to a net loss account. But when I started demo trading with specific trading strategies, my loss started to become a tolerable one. Trades with such strategies, I also started to build my confidence in forex trading which was a very negative one earlier. I started to lose hope and give away forex trading. But suddenly I've found a very good resource. With the proper use of it, I started to regain my lost confidence.

Another thing besides money management I've learned another thing. It has been discussed in the tutorials though.... I want to name it in a different way. That is, psychological management. Without this also, one cannot be a successful trader. During my demo trading with some popular strategies, I've found that, sometimes it becomes impossible to control my emotion regarding execution of a order in the trade.

During some trading I've found that, sometimes, indicators in a strategy, yet to give a signal but in a raw look, it seems that an entry is inevitable and profitable. Irresistible desire to get profit compels to enter a position when the indicators of the strategy in hand doesn't give any signal yet. Most of the times, it's found that, no signal generated where we already entered into the trade.

I know, sometimes, our intuitions are correct and not following our emotion leads to loss of some pips but in the long run, strictly following a strategy pays off. Developing this skill of psychological management is the most tough part, I think. Thus, money management & psychological management are the integral part of preparation for forex trading. I'm passing through this tough stage now. I believe, I'll need more time to learn these.

Friday, 23 December 2011

Chart patterns to identify future currency movement

Identifying chart pattern is one of the very important part of technical analysis. I was studying about chart patterns recently. During reading, it seems to be very easy to understand as the training materials shows the charts with marking the chart patterns. But when I try to find out a chart pattern in a live chart..... I feel like, I'm lost. I find nothing. I think, it needs more reading and regular practice of trying to find chart pattern.

I think, zooming out a live chart to get an overview of a larger picture in a different time frame might help finding a chart pattern. Yesterday, I was looking for chart pattern.....
Currency pair: EUR/USD
Time frame: 15M
Yesterday, I plotted the lines and thought it to be a pennant formation. Which means, price will continue previous trend. That is, if it forms after a downtrend, it will go downwards. It's a consolidation phase. So I went to bed assuming, price will go downwards and planned to show my analysis in the blog.

But today I found that price went upwards to previous swing high level. So I started to think, what wrong I've done here...why my calculation went wrong. I went through my tutorial again and then I found that I was wrong in my analysis in the very beginning. Pennant form after a very strong trend, almost a vertical trend. But here the market was almost moving sideways if we can just ignore that one small swing.

See, when it formed the ADX (14) was below 20. So strength of the trend was very poor. In fact it was a triangle, a symmetrical triangle (again, I'm not sure. I'm giving my opinion according to my own understanding by learning from online free tutorial). A symmetrical triangle can lead price to any direction. So when a symmetrical triangle forms, many traders gives two pending order, one above the triangle, a long position and another below the triangle, a short position. When one order hits, other closes. In this case price moved upwards.
A gain of about 40 pips. Not bad..... Holiday period now....markets should be ranging with some exceptions....

USD/JPY, 4 hour chart, a great buy signal

Strategy Collected from: FSR
Strategy no: Simple #1
Trading platform: MT4
Currency pair: USD/JPY
Time frame: any
Indicators: 5 & 10 EMA, Stochastic (14,3,3) & RSI (14)


A buy signal generates when 5 EMA crosses above of 10 EMA with stochastic heading upwards & not in overbought position and RSI is above 50. I've missed the opportunity yesterday. See here...
I've pointed out the points where the rules applied. Every indicator has given a good entry signal. What should be our target here regarding gaining profit. Before entry, we should work out all of this. First, what is the market condition? How much profit do we want?

Let us see again in the above picture but with some more modification below to understand what I'm going to say.....
Look, thick yellow line.... It's the support line. I've left the resistance line for you.... So the market is moving sideways....Look, the price has given buy signal just after it has bounced off of the support line. And it's moving towards the resistance line. So TP should be at that level. Or we can take a portion of the position and keep the rest to see if any breakout is going to happen or not. But as the holidays ahead along with forex weekend, breakout is unlikely.....

I'm giving my opinion from a learner's view. So I might be wrong. And again, I'm not considering the news event here...

Wednesday, 21 December 2011

EUR/USD, Daily chart with EMA & ADX system

Strategy collected from: FSR
Strategy no: Advanced #6
Trading platform: MT4
Currency pair: EUR/USD
Time frame: any
Indicators: 20 & 40 EMA and ADX (14)

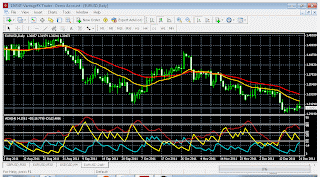
With this strategy, any pair can be targeted in any time frame. According to the entry rules mentioning... enter when price bounces back from 20 EMA line with ADX (14) at above 30 level in a higher time frame available.... See the image below...
As it's a daily chart... wait..... From the above picture.... carefully see.... latest candle is touching the 20 EMA line from below. ADX (14) is above 30 level. This is the entry point for short position. But look at the ADX line... it's approaching the 30 line and probably at the next candle, it'll touch 30 which is a sign of exit (If I'm not wrong). So should I enter at this position?? I've posted the same position in the main site... Just asking, if anyone has any answer...

I've just entered a short position because, I want to test the strategy to get a profitable one. If I just seat back assuming what happen, then I won't be able to find one. What's the demo trade for?? I've asked the expert one. We'll be able to check the comment with a real time result.
Now wait and wait......

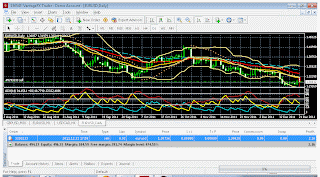
It worked. with a 2 micro lot short position already generated $2.40. But I'll wait for sell signal to generate following strategy.....
At the time of publishing the profit reached to $3.36..... remember, it's from a trade with only 2 microlot. I'll publish the final image after closing the position.

I've just closed my position with 40 pips as the market started ranging due to holidays ahead.... These holidays period is frustrating as price does not go anywhere..... I think, I'll refrain from enter any position till January 2012. By this time, I'll continue my study about forex...... I've downloaded 2 books. I'll let you know about those after I read them.....

Happy Holiday!!

USD/JPY, 30 min chart with SAR +ADX strategy

Strategy collected from: FSR
Trading Platform: MT4
Currency pair: USD/JPY
Time frame: M30
Indicator: Parabolic SAR & ADX with +DI, -DI combination
Indicator-Additional to the main strategy: 5 & 12 EMA, 63 SMA
Original strategy gives buy signal when +DI is above -DI along with support of Parabolic SAR. If parabolic SAR gives a signal but +DI & -DI gives opposite then SAR should be ignored.... and vice versa. Close a position when +DI & -DI crosses....

Here in my present trade, with my additional EMA ...I've got an early buy signal which itself a good indicator but the +DI & -DI was showing the opposite......

No trade here, if I follow the original strategy..... But just check it, whether we can get an early entry with the help of additional MA indicators.... I entered a long trade after the +DI crossed over the -DI. But if I would have entered with the cross of 5 EMA over the 10 EMA with the support of parabolic SAR.... Let's see what happens and what would happened next....


With the entry following main strategy.... a loss trade incurred... I might be wrong in following the strategy as I'm a newbie..... see the next image..... the arrow indicates the level of entry with the original strategy....And red box indicates that with 5 & 12 EMA, 10 pips profit could be drawn before reaching the original entry level....


So this strategy gives late signal......But It's a reliable strategy.. Works well in trending market, I think.

Popular Posts

HotForex Bonus