Strategy collected from: FSR
Trading Platform: MT4
Currency pair: USD/JPY
Time frame: M30
Indicator: Parabolic SAR & ADX with +DI, -DI combination
Indicator-Additional to the main strategy: 5 & 12 EMA, 63 SMA
Original strategy gives buy signal when +DI is above -DI along with support of Parabolic SAR. If parabolic SAR gives a signal but +DI & -DI gives opposite then SAR should be ignored.... and vice versa. Close a position when +DI & -DI crosses....
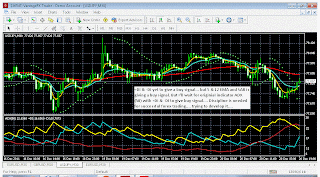
Here in my present trade, with my additional EMA ...I've got an early buy signal which itself a good indicator but the +DI & -DI was showing the opposite......
No trade here, if I follow the original strategy..... But just check it, whether we can get an early entry with the help of additional MA indicators.... I entered a long trade after the +DI crossed over the -DI. But if I would have entered with the cross of 5 EMA over the 10 EMA with the support of parabolic SAR.... Let's see what happens and what would happened next....
With the entry following main strategy.... a loss trade incurred... I might be wrong in following the strategy as I'm a newbie..... see the next image..... the arrow indicates the level of entry with the original strategy....And red box indicates that with 5 & 12 EMA, 10 pips profit could be drawn before reaching the original entry level....
So this strategy gives late signal......But It's a reliable strategy.. Works well in trending market, I think.


No comments:
Post a Comment