Strategy collected from: FSR
Strategy no: Advanced #6
Trading platform: MT4
Currency pair: EUR/USD
Time frame: any
Indicators: 20 & 40 EMA and ADX (14)
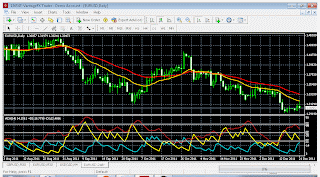
With this strategy, any pair can be targeted in any time frame. According to the entry rules mentioning... enter when price bounces back from 20 EMA line with ADX (14) at above 30 level in a higher time frame available.... See the image below...
As it's a daily chart... wait..... From the above picture.... carefully see.... latest candle is touching the 20 EMA line from below. ADX (14) is above 30 level. This is the entry point for short position. But look at the ADX line... it's approaching the 30 line and probably at the next candle, it'll touch 30 which is a sign of exit (If I'm not wrong). So should I enter at this position?? I've posted the same position in the main site... Just asking, if anyone has any answer...
I've just entered a short position because, I want to test the strategy to get a profitable one. If I just seat back assuming what happen, then I won't be able to find one. What's the demo trade for?? I've asked the expert one. We'll be able to check the comment with a real time result.
Now wait and wait......
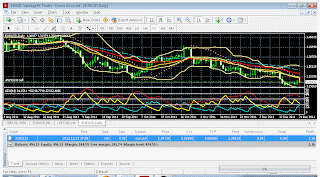
It worked. with a 2 micro lot short position already generated $2.40. But I'll wait for sell signal to generate following strategy.....
At the time of publishing the profit reached to $3.36..... remember, it's from a trade with only 2 microlot. I'll publish the final image after closing the position.
I've just closed my position with 40 pips as the market started ranging due to holidays ahead.... These holidays period is frustrating as price does not go anywhere..... I think, I'll refrain from enter any position till January 2012. By this time, I'll continue my study about forex...... I've downloaded 2 books. I'll let you know about those after I read them.....
Happy Holiday!!


No comments:
Post a Comment