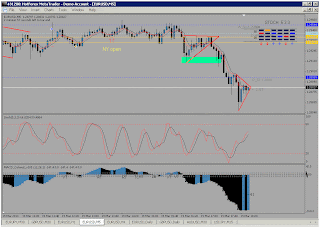
Today also was not a good day for force strategy. Before open of Tokyon session, price started to move down. After open, price started to moe sideways.
 |
| Figure 01: EURUSD 5m chart |
Price produced hidden bullish divergence. Price then without moving any direction, it started to move sideways. Now let's see some example of other trade.
 |
| Figure 02: GBPUSD daily chart. |
Here this trade is done according to
this rule.
After waiting for quite some time, price started to show some big move. Price also started to produce a sell signal. I took the short signal.
 |
| Figure 03: EURUSD 5m chart |
But I lossed 12 pips. I entered the position without any confirmation. Look How I missed the point. MACD bars were shortening at below zero level. After this price produced a good sell signal.
 |
| Figure 04: EURUSD 5m chart |
Grabbed only 7 pips. Price then produced a good long signal.
 |
| Figure 05: EURUSD 5m chart |
Look, everything was in line. A good long signal. It shouldn't go wrong.
 |
| Figure 06: EURUSD 5m chart |
Why didn't this signal work? Look the weekly S1 was just 6 pips above when I took the signal. So there was not enough space for the price to move. Lost 12 pips here.
 |
| Figure 07: EURUSD 5m chart |
Look how the price action looks above. It's forming a bear channel.
 |
| Figure 08: EURUSD 5m chart |
Price started to move downwards. Price then reached DS1. Price is likely to pull back from DS1. But price didn't pull back, rather went down and fromed a pennant.
 |
| Figure 09: EURUSD 5m chart. "Pennant" |
No more today. Not a good day for force 5m. Average pip collection was not bad. 25 pips gain for today.


No comments:
Post a Comment