Today was a holiday and many financial institutions were closed. So it was a no trade day for me like many others.
I've decided to do some studies today. But falied to do so as I was busy in my work. I'm going to start live trading very soon.
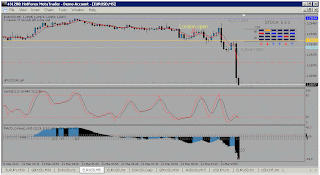
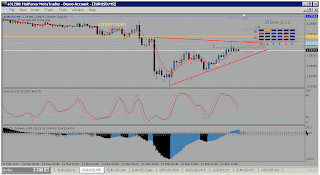
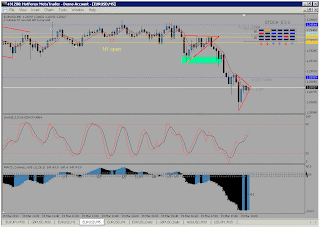
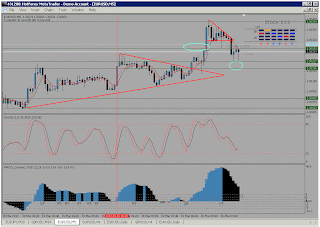
EUR/USD pair also moved against the primary trend today. AUD/USD moved sideways. EUR/JPY also moved sideways. These were my targeted pairs.
Finally total pips collected this week is: 151.
Saturday 30 March 2013
Thursday 28 March 2013
AUD/USD pair on bearish run
AUD/USD pair is gradually started to move downwards. I was monitoring it today. Price crossed a prevous demad area quickly.
I showed you in my yesterday's blog entry that I missed few long entries along with a very good short entry. That's why I was keeping an eye on this pair. After yesterdays down move, price pull backed to the EMA from the demad area. Then from there it bounced back and passed thrugh the demand area making it a supply area. After passing the supply area price was likely to revisit the area before proceeding further.
In a daily chart, price made a engulfing bear candle at the top of the trend. Price is likely to go down. A shorting opportunity here. Stoch is in the overbought area approaching downwards.
Besides the above mentioned set up, on an hourly chart with another strategy, also a short signal generated. I'll show you the strategy later. So I'm not showing the image. With the daily chart in zoomed out view, price is now at such a place where a short entry is visbly safe.
I took the short trade, a little late though. A targetted 1:2 risk reward ratio. With achieving my target, I cleared major portion of my position, kept the rest to run with s/l at BE.
Price was also approaching lower demand area. Here is my 24 pips. I'll let the rest run as I entered into the bear trend near the starting point. Let's see how far it goes.
So far 24 pips today. 14 pips more in EUR/JPY pair. Total 38 pips.
 |
| Figure 01: AUDUSD 1 H chart. |
In a daily chart, price made a engulfing bear candle at the top of the trend. Price is likely to go down. A shorting opportunity here. Stoch is in the overbought area approaching downwards.
 |
| Figure 02: AUD/USD daily chart, "Bearish engulf" |
 |
| Figure 03: AUD/USD daily chart |
 |
| Figure 04: AUD/USD 1H chart |
So far 24 pips today. 14 pips more in EUR/JPY pair. Total 38 pips.
Learning by missing entries
I'm demo trading now for more than a year now. It is about 15 months to be specific. Now I think I'm starting to understand more and more each day. I'll have to diversify my trading pairs. I've looked today several pairs. Let me show what I've found so far.
AUD/USD pair, 30 min time frame, using 50 SMA & CCI, I found that, trend was bullish. So basically long entry should be looked for. I missed 3 entries in last couple of days. Today price is reversing and here also I missed a trade.
Before reversing pirce gave a week long signal. I took it when, CCI came above -100 from below, stoch came out of oversold area. I got 6 pips there. CCI along with 50 SMA give good trade signal.
After this long trade, price started to give a short signal. As it was bullish trend, I stayed away from entering short trade.
Look I marked the short entry points. But I didn't understand that this short term trend was reversing here. Daily and weekly trend is somewhat sideways though.
Now XAUUSD, 1H time frame, supply-demand area, CCI and 50 EMA. In a bearish trend price was in a demand area, CCI came down from overbought area. I took the short entry.
I grabbed here 24 pips. As price reache the oversold area and it was about to trun back, I came out quickly. Here I entered into the trade when price came out of the supply area.
Next I traded USDJPY pair in 1H chart. Here supply-demand area and stoch. Price was revisiting a demand area and stoch was nearing the oversold area. I put a limit buy order which was activated nicely by the wick of a bull candle.
This bounce from demand area was slightly above the 61.8 pivot level. So there was various reason for the long entry. But I missed the trend. It was in a down trend.
Look, 200 EMA, upper supply area and upper line of a bear channel all met a point where price bounced above with stoch in the overbought area. So I think it was an ideal short trade which I missed and entered into the long trade.
I got out of this wrong trade with 12 pips.
So total : 6+24+12=42 pips.
This is for today.
AUD/USD pair, 30 min time frame, using 50 SMA & CCI, I found that, trend was bullish. So basically long entry should be looked for. I missed 3 entries in last couple of days. Today price is reversing and here also I missed a trade.
 |
| Figure 01: AUDUSD 30m chart |
After this long trade, price started to give a short signal. As it was bullish trend, I stayed away from entering short trade.
 |
| Figure 02: AUDUSD 30m chart |
Now XAUUSD, 1H time frame, supply-demand area, CCI and 50 EMA. In a bearish trend price was in a demand area, CCI came down from overbought area. I took the short entry.
 |
| Figure 03: XAUUSD 1H chart |
Next I traded USDJPY pair in 1H chart. Here supply-demand area and stoch. Price was revisiting a demand area and stoch was nearing the oversold area. I put a limit buy order which was activated nicely by the wick of a bull candle.
 |
| Figure 04: USDJPY 1H chart |
 |
| Figure 05: USDJPY 1H chart |
 |
| Figure 06: USDJPY 1H chart |
So total : 6+24+12=42 pips.
This is for today.
Tuesday 26 March 2013
Trading with 5m Force strategy, Day 31
I was also busy today. So I could only stayed in front of the chart for 1 hour. To be specific, less than 1 hour. So I'm giving the only screenshot of my trade.
Got into the trade a little early. Otherwise profit could be more. Anyway, gain is not bad considering the time I could give for it. Closed another position from previous day.
Today 14 + 21=35 pips.
Got into the trade a little early. Otherwise profit could be more. Anyway, gain is not bad considering the time I could give for it. Closed another position from previous day.
Today 14 + 21=35 pips.
Monday 25 March 2013
Trading with 5m Force strategy, Day 30
Today, My daughter's birthday. She stepped into three. Usually I could not spend time with her. So I decided to be with her all day. I managed to see the chart for a little. I just want to share what I found...
38 pips gain after a open in gap down following last weekend. I had a long order kept open. Price after opening with a gap down, went sharply up to fill the gaps of prevous week's gap almost.
Then, I don't know what the hell happened, I took a long trade from nowhere.
I grabbed 12 pips though. But this type of trade destroys trading and wipes away the balance. The set up was prepared for a short entry. I had a sell limit order but missed by few pips. Perhaps this made me frustrated and out of this I got into the long trade. I should control such emotions.
Look the short entry I missed could gave me the trade of the day with more than 100 pips.
Total pips gain today: 38 + 12 = 50.
Today I haven't actually traded with 5m force strategy. Just monitored the market.
 |
| Figure 01: EURUSD 5m chart. "Tokyo open" |
 |
| Figure 02: EURUSD 1H chart |
 |
| Figure 03: EURUSD 5m chart. "London open" |
 |
| Figure 04: EURUSD 1H chart |
Look the short entry I missed could gave me the trade of the day with more than 100 pips.
 |
| Figure 05: EURUSD 1H chart |
Today I haven't actually traded with 5m force strategy. Just monitored the market.
Friday 22 March 2013
Trading with 5m Force strategy, Day 29
Today I actually didn't trade with 5m force strategy. This week I was having discipline in my trading. So I concentrated on studying.
Good time for 5m force strategy came after the opening of NY session.
Adequate number of pips are available during this NY sessions.
This week's total collected pips amount: 117
Good time for 5m force strategy came after the opening of NY session.
Adequate number of pips are available during this NY sessions.
This week's total collected pips amount: 117
Thursday 21 March 2013
Trading with 5m Force strategy, Day 28
 |
| Figure 01: EURUSD 5m chart |
 |
| Figure 02: USDJPY 1H chart |
I think, I'll have to post different post for the trade with different strategy. I'll do it from next time. Negetive points are- price was not revisiting the level for the first time. And when the price actually revisiting the level, price didn't stop at the level rather it went through the level. It signifies that the level might not have enough to give. Let's see what happens here.
I'm not still having any good force signal. Probably news event is hampering the flow of price. Few minutes back, report released for German flash manufacturing PMI. It caused sharp more than 30 pips downward move. I entered on the second candle because, I once read about a strategy involved the news event. I'm implementing the strategy regularly. But it's not been a successful strategy till now. Let see...
 |
| Figure 02: EURUSD 5m chart. "German flash manufacturing PMI" |
 |
| Figure 03: EURUSD 5m chart |
 |
| Figure 04: EURUSD 5m chart |
 |
| Figure 05: EURUSD 1H chart |
 |
| Figure 06: EURUSD 5m chart |
 |
| Figure 07: EURUSD 5m chart |
I took a short signal by force strategy before going for lunch.
 |
| Figure 08: EURUSD 5m chart |
 |
| Figure 09: EURUSD 5m chart |
Now price is forming a pattern. What is it?
 |
| FIgure 10: EURUSD 5m chart. "Ascending triangle" |
or
 |
| Figure 11: EURUSD 5m chart. "Ascending wedge" |
I think it's the later one. Now I'm going to take rest. Without proper rest, trading properly is not possible.
Total 23 pips today. It could be more than 50. But early exit reduced my profit.
Wednesday 20 March 2013
Trading with 5m Force strategy, Day 27
Today started with 16 pips in GBPUSD pair. Before London open price was moving slowly upwards. But after London open price was started to move up and down giving long and short signals.
After that price started to give long signal according to force advanced signal.
I took the short signal with the bounce from upper supply area. Got 9 pips here. Then entered short again and got 13 pips.
After NY open price again started to move to north sharp. Missed the entry. Missed good >40 pips. After the upward rally price again started to and fro movement. There some force signal generated. I could took one short entry.
Grabbed another 10 pips here.
Total pips: 43 pips by force signal. 16 pips from other trade. Grand total:59 pips.
 |
| Figure 01: EURUSD 5m chart |
 |
| Figure 02: EURUSD 5m chart |
After NY open price again started to move to north sharp. Missed the entry. Missed good >40 pips. After the upward rally price again started to and fro movement. There some force signal generated. I could took one short entry.
 |
| Figure 03: EURUSD 5m chart |
Total pips: 43 pips by force signal. 16 pips from other trade. Grand total:59 pips.
Tuesday 19 March 2013
Trading with 5m Force strategy, Day 26
Today also was not a good day for force strategy. Before open of Tokyon session, price started to move down. After open, price started to moe sideways.
Price produced hidden bullish divergence. Price then without moving any direction, it started to move sideways. Now let's see some example of other trade.
Here this trade is done according to this rule.
After waiting for quite some time, price started to show some big move. Price also started to produce a sell signal. I took the short signal.
But I lossed 12 pips. I entered the position without any confirmation. Look How I missed the point. MACD bars were shortening at below zero level. After this price produced a good sell signal.
Grabbed only 7 pips. Price then produced a good long signal.
Look, everything was in line. A good long signal. It shouldn't go wrong.
Why didn't this signal work? Look the weekly S1 was just 6 pips above when I took the signal. So there was not enough space for the price to move. Lost 12 pips here.
Look how the price action looks above. It's forming a bear channel.
Price started to move downwards. Price then reached DS1. Price is likely to pull back from DS1. But price didn't pull back, rather went down and fromed a pennant.
No more today. Not a good day for force 5m. Average pip collection was not bad. 25 pips gain for today.
 |
| Figure 01: EURUSD 5m chart |
 |
| Figure 02: GBPUSD daily chart. |
After waiting for quite some time, price started to show some big move. Price also started to produce a sell signal. I took the short signal.
 |
| Figure 03: EURUSD 5m chart |
 |
| Figure 04: EURUSD 5m chart |
 |
| Figure 05: EURUSD 5m chart |
 |
| Figure 06: EURUSD 5m chart |
 |
| Figure 07: EURUSD 5m chart |
 |
| Figure 08: EURUSD 5m chart |
 |
| Figure 09: EURUSD 5m chart. "Pennant" |
Monday 18 March 2013
Trading with 5m Force strategy, Day 25
First day of the week. It started with a price gap down for EURUSD and also fr other EUR related currency pairs due to Cyrprus related news.
It was huge >150 pips down. Price then started to move sideways. Before the open of London session, price started to move upwards with force long entry signal. I could not takeit as price was moving both ways. I got confused. I wanted to stay out but I actually took the force sell signal. I wanted to see whether force signal is safe or not.
Immediately before open price went down and after open, price went up. Here ar my trades.
Total 37 pips loss with force signaly during the London opening hours. A bad day for alll. Many trader lost from the starting of the day.
As price showed some unexpected behaviour..... Price produced a huge gap down, so an upward movement was expected. I think I got that immediately after the London open.
Got 41 pips there. Price started to bounce back from the upper supply area.
Price retraced to weekly S1and also backed by fib level 23.6%. Price went to previous supply area for the second time. It's likely to pull back.
Price moved more than 30 pips but before that it again pulled back to upper supply area. Then I left the screen. I had to go outside. I can't stay infront of screen all the time. Two good opportunity came two and half hours after the NY open. Two sell signals. Before going to bed I took another sell signal. As I had to go to bed after day long market monitoring I gout out of my short trade with 7 pips. But later found, I could take lot more.
Over all I had 10 pips positive gain. But Force strategy gave >30 pips loss. Actually, I think all was not force fault. My execution was bad. But my other trades saved me.
 |
| Figure 01: EURUSD 5m chart |
 |
| Fiugre 02: EURUSD 5m chart |
 |
| Figure 03: EURUSD 5m chart |
As price showed some unexpected behaviour..... Price produced a huge gap down, so an upward movement was expected. I think I got that immediately after the London open.
 |
| Figure 04: EURUSD 5m chart |
 |
| Figure 05: EURUSD 5m chart |
 |
| Figure 06: EURUSD 5m chart. Pull back from supply area |
Over all I had 10 pips positive gain. But Force strategy gave >30 pips loss. Actually, I think all was not force fault. My execution was bad. But my other trades saved me.
Friday 15 March 2013
Trading with 5m Force strategy, Day 24
Today I had to go to work, so market monitoring was not so meticulous. At around 10:00 a.m price gave a good buy signal which I missed. Here is the trade-
Price moved sharply up for more than 10 solid pips. Then price started to move sideways within the previous supply area. From the top region of the area, price started to move downwards. Missed this nice entry.
Price then started to move upwards after the downward movement. Price then reached the supply area again which was the first revisit of price into the supply area. From there, short trade could be taken.
But there were few supply and demand area below it. So short trade will not be wise. Then price pattern starte to from a symmetrical triangle.
Price broke upwards. There were longer term upper TL and weekly pivot above. But both were broken.
Price formed a descending triangle above the previous triangle.
Price is about to go down from descending triangle. But I decided to watch as I'm not expert at price action pattern. So I don't actully know whether I'm right in drwaing patterns.
Price nicely went down. I missed good 18 pips at least. Price then started to move up generating a good force buy signal.
I got out of the trade with 9 pips but I could have 28 pips at least if I could stick to the trade. Next I saw a flag formed. I don't know whether I'm right or wrong.
I took 4 pip by long position after the flag.
News event is ahead. Let's see what happened after the news event "Core CPI m/m".
News effect lasted only for 5 mins. After that another news event was coming but of medium impact. After that news event price produced a good sell sgnal. I took it.
Grabbed 8 pips there. I got out too early here also. Could get more than 30 pips. Then a buy signal came by force strategy.
After that I took three more sell signal and one buy signal by force strategy. Two trades produced -11 pips and rest two produced 14 pips.
Total gain today is 35 pips. Total 10 trades by force. 2 were loser. One was my fault. At least 2 winner trade could generate more than triple profit.
More than 200 pips this week.
 |
| Figure 01: EURUSD 5m chart |
 |
| Figure 02: EURUSD 5m chart |
 |
| Figure 03: EURUSD 5m chart. |
 |
| Figure 04: EURUSD 5m chart |
 |
| Figure 05: EURUSD 5m chart. "Symmetrical triangle" |
Price formed a descending triangle above the previous triangle.
 |
| Figure 06: EURUSD 5m chart. "Descending Triangle" |
 |
| Figure 07: EURUSD 5m chart |
 |
| Figure 08: EURUSD 5m chart |
 |
| Figure 09: EURUSD 5m chart |
 |
| Figure 10: EURUSD 5m chart |
 |
| Figure 11: EURUSD 5m chart. "Core CPI m/m" |
 |
| Figure 12: EURUSD 5m Chart |
 |
| Figure 13: News event |
 |
| Figure 14: EURUSD 5m chart |
Total gain today is 35 pips. Total 10 trades by force. 2 were loser. One was my fault. At least 2 winner trade could generate more than triple profit.
More than 200 pips this week.
Subscribe to:
Posts (Atom)
Popular Posts
-
Today I had to go to work, so market monitoring was not so meticulous. At around 10:00 a.m price gave a good buy signal which I missed. Here...
-
This is AUDNZD in one hour time frame. It looks like a nice down trend. Since the price has already bounced from the dynamic resistance ...


