Today, there are some high imapct news/event to be released. These are French Flash Manufacturing PMI (EUR),German Flash Manufacturing PMI (EUR), Retail Sales m/m (GBP), BOJ Gov Kuroda Speaks (JPY), Spanish 10-y Bond Auction (EUR), Core Retail Sales m/m (CAD), Unemployment Claims (USD), Existing Home Sales (USD), Philly Fed Manufacturing Index (USD). I've listed only those yet to be released by now. So an eventful day today. I'll be careful today.
 |
| Figure 01: EURUSD 5m chart |
Before Tokyo sesseion started today, price was gradually declining. After opening of Tokyo session price went sharply up. Then went sideways for 2 hours before started to rise again. Today I happened to be in front of the screenb but stayed only for couple of bars. So I missed the sharp rise. Now let's see another pair where I'll keep my eyes.
 |
| Figure 02: USDJPY 1H chart |
In this 1H chart, I've marked 3 levels. "A" is where price stopped aftera rally and dropped quickly. So it's a good supply area. In this way "C" & "D" are the level which are major supplya and demand area respectively. I entered into a long trade after the pull back from the point B. It's not an ideal trade. I actually learned this recently and found the negetive point this special entry after I've took the position. To be more specific, during writing the post, I've identified it.
I think, I'll have to post different post for the trade with different strategy. I'll do it from next time. Negetive points are- price was not revisiting the level for the first time. And when the price actually revisiting the level, price didn't stop at the level rather it went through the level. It signifies that the level might not have enough to give. Let's see what happens here.
I'm not still having any good force signal. Probably news event is hampering the flow of price. Few minutes back, report released for German flash manufacturing PMI. It caused sharp more than 30 pips downward move. I entered on the second candle because, I once read about a strategy involved the news event. I'm implementing the strategy regularly. But it's not been a successful strategy till now. Let see...
 |
| Figure 02: EURUSD 5m chart. "German flash manufacturing PMI" |
Most of the times I've found that news effects found in 5m single candle. And most of the time occurs in few seconds. So very tough to catch the price action during news events. Another strategy regarding news event is there. I think I'll start that in a couple of months before which I'll continue to stduy the present strategy. I know moving from one strategy to another is not good. But news event needs no chart analysis. So I can change it in short interval. It's my opinion.
 |
| Figure 03: EURUSD 5m chart |
I've exited the trade with 2 pips gain as this trade had nothing to gain. Again there were another news event few minutes later. So let's wait to see the effect. It is about Flash manufacturing PMI. This event was of medium impact though.
 |
| Figure 04: EURUSD 5m chart |
Then news event went to opposite direction. But as price was approaching DP, WS1 and a supply area shown in the image below, I decided to stay out of any long trade now.
 |
| Figure 05: EURUSD 1H chart |
Look, This is 1H tf of EURUSD. The current price action is marked. Price is approaching supply area. Now, at the moment of taking above image, price was giving a long entry by force signal. Let's see what happened next.
 |
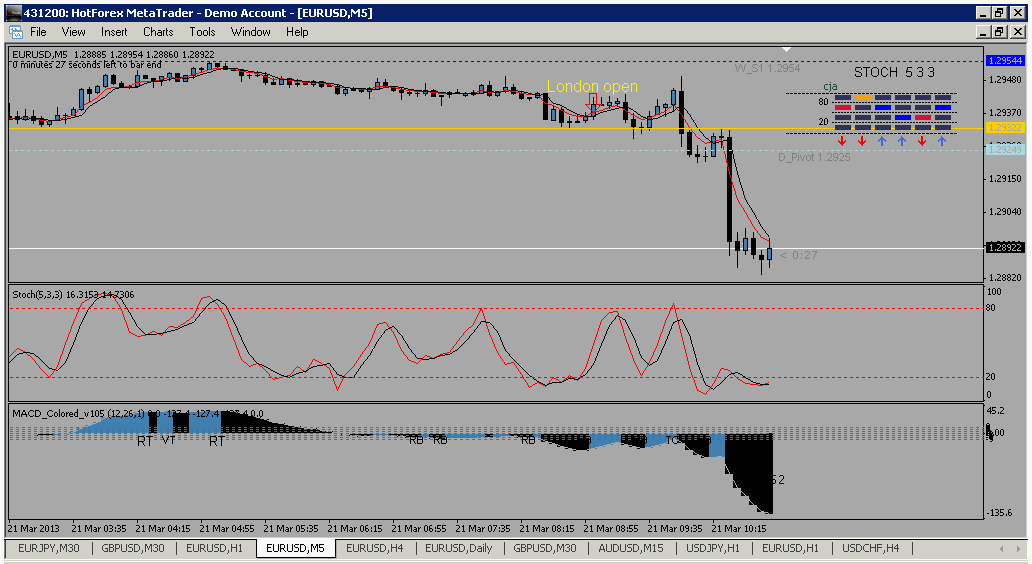
| Figure 06: EURUSD 5m chart |
Price went down due to news event. Look at the MACD. I think price will go up slowly until next news event at least. If news fabours then it'll continue the flow. It's 6 minutes until the next news event. See what's price is doing.
 |
| Figure 07: EURUSD 5m chart |
Price is gradually going up. Stoch is in the overbought area. Even then price is going up. I think there is no valid trade for me today.
I took a short signal by force strategy before going for lunch.
 |
| Figure 08: EURUSD 5m chart |
Got 4 pips there though price initially started to move away. I could get more pips if I could stay in front of the screen. While I was at lunch, missed the exit of this trade and entry of another long trade following it.
 |
| Figure 09: EURUSD 5m chart |
I could grabbed at least 30 pips in thses two trades. These opportunities are rare in a day full of news. I should have guessed it as from 4:00 pm to 6:00 pm BST there were no news directly related to EUR or USD. So a little bit smooth price flow was expected.
Now price is forming a pattern. What is it?
 |
| FIgure 10: EURUSD 5m chart. "Ascending triangle" |
or
 |
| Figure 11: EURUSD 5m chart. "Ascending wedge" |
I think it's the later one. Now I'm going to take rest. Without proper rest, trading properly is not possible.
Total 23 pips today. It could be more than 50. But early exit reduced my profit.